- 取得連結
- X
- 以電子郵件傳送
- 其他應用程式
跟著Earth lab的內容逐步練習
基本概念
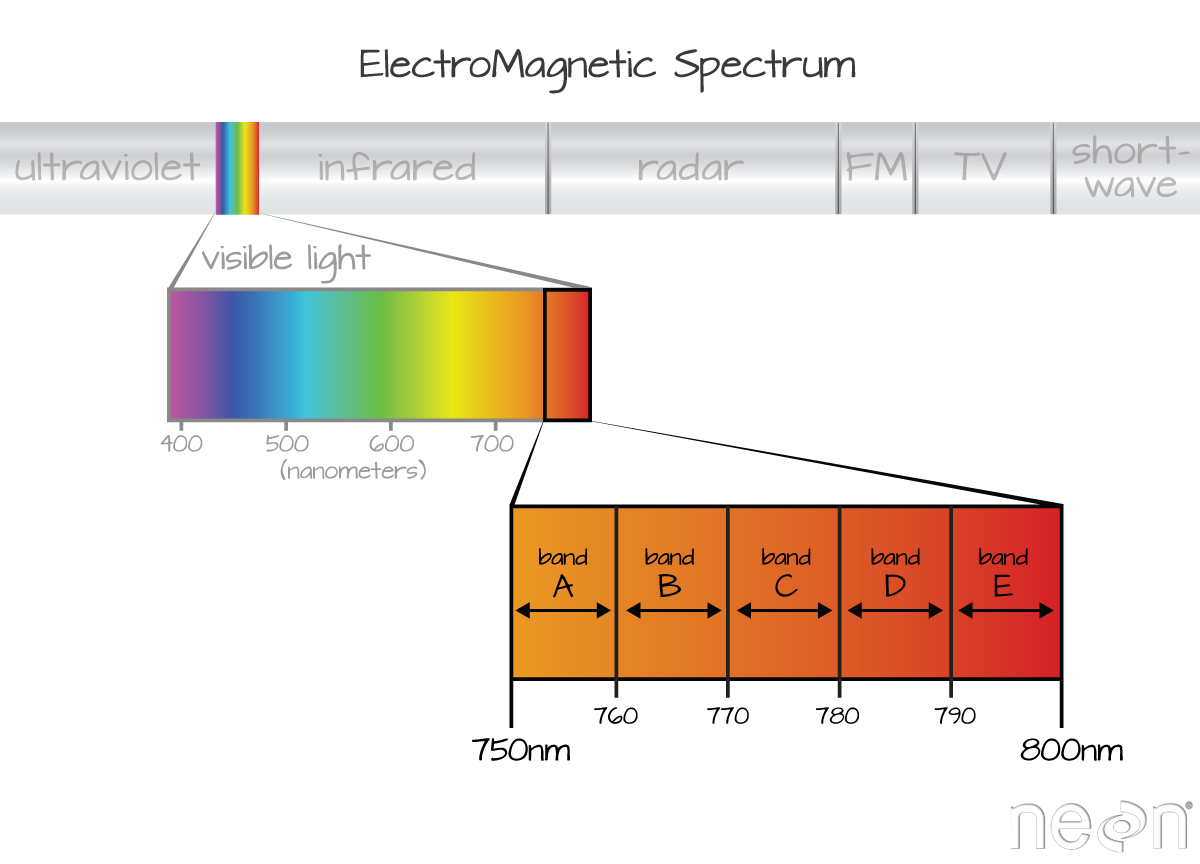
通常在表達波段的時候,都是選用波段的中間值表示,例如820-830 nm,我們就會說是825 nm。

高光譜和多光譜的差異在於波段的數量,從GIS geography可以找到以下的解釋
- Multispectral: 3-10 wider bands.
- Hyperspectral: Hundreds of narrow bands
資料出處:
https://gisgeography.com/multispectral-vs-hyperspectral-imagery-explained/
https://gisgeography.com/multispectral-vs-hyperspectral-imagery-explained/
使用Python 操作多光譜
rasterio.open() 函數用來打開多光譜影像
stack() 函數可用來引入多光譜資料
earthpy的plot_rgb() 函數用來指定波段
stack() 函數可用來引入多光譜資料
earthpy的plot_rgb() 函數用來指定波段
開始吧
首先載入所有必要的元件
import os
import matplotlib.pyplot as plt
import numpy as np
import rasterio as rio
import geopandas as gpd
import earthpy as et
import earthpy.plot as ep
需要額外安裝的套件包括rasterio, geopandas, earthypy,可以從anaconda power shell prompt 安裝。
接著設定路徑
path = "D:\Python\multispectral"
os.chdir(path)
plt.rcParams['figure.figsize'] = (10, 10)
plt.rcParams['axes.titlesize'] = 20
接著我們載入影像,使用rasterio(縮寫為rio)的open function,把它取名為msi,這裡是multispectral image 的意思,把圖檔命名為pine0808
pine_path = os.path.join("pineapple","pineapple0808.tif")
with rio.open(pine_path) as msi:
    pine0808 = msi.read()
Matplotlib
Matplotlib的imshow函數可以進行繪圖,我們使用matplotlib.pyplot(縮寫為plt) 進行繪圖,imshow這一個函數只能畫出單一圖層,我們就選擇藍光波段來畫,在圖後面加上[0]。
fig, ax = plt.subplots()
ax.imshow(pine0808[0])
ax.set_title("Pineapple Multispectral image \n Band 1 Blue")
plt.show()
Python 的計數是從0開始,我們就可以依此類推:
[0] - Blue
[1] - Green
[2] - Red
[3] - Red Edge
[4] - Near IR
Earthpy
earthpy 函數可以畫單一圖層,也可以進行RGB 的套疊
先用ep.plot_bands()來畫單一波段的圖層
ep.plot_bands(pine0808[0],
              title="Pineapple Multispectral image \n Band 1 Blue",
              cbar=True,vmin=100,vmax=2000)
plt.show()ep.plot_bands()把所有的波段畫出來,話說不知道為什麼,正射影像會多一個波段的資訊,但是那實際是空的。
titles = ["Blue Band", "Green Band", "Red Band","Red Edge", "Near Infrared (NIR)","plot"]
ep.plot_bands(pine0808,
              figsize=(12, 5),
              cols=3,
              title=titles,
              cbar=False,
              vmax=15000)
plt.show()
ep.plot_rgb(),可以選擇波段,畫出具有紅、藍、綠三個顏色,我們先嘗試使用原本的顏色來畫圖
ep.plot_rgb(pine0808,
            rgb=[2, 1, 0],
            title="RGB Composite image - pineapple",
            figsize=(15, 8),
            stretch=True)
plt.show()
畫出來的圖比qgis自然許多,但是圖片偏暗,應該和各個波段的訊號有關。
另一個在植物光譜上面很有意思的方法,是用紅外光取代紅光的波段。將上面指令稍作修改rgb=[4, 1, 0]
參考網站
https://www.earthdatascience.org/courses/use-data-open-source-python/multispectral-remote-sensing/intro-multispectral-data/
https://github.com/earthlab/earthpy
https://earthpy.readthedocs.io/en/latest/gallery_vignettes/index.html


留言
張貼留言